
Oakland, California: A Case Study
June 29, 2015 | Revolution Newspaper | revcom.us
We received this preliminary report from a group of readers:
This preliminary report on Oakland was undertaken to get a clearer and more objective understanding of the conditions that exist there for the Black population in particular.
Oakland is a city with a large and vibrant Black and Latino population. It is a city with a long and important history of struggle which includes the emergence of the Black Panther Party, a long history of struggle against police abuse and murder including that around the BART police murder of Oscar Grant, a history of militant, even radical unionism, including the recent port shutdown May 1 by the Longshoremen’s union, and a powerful while short-lived movement that emerged around Occupy. Oakland has been an important center of struggle in the movement that emerged in Ferguson and since.
So Oakland is unique in some ways—but the lives and conditions of Black and Latino people in Oakland are typical of cities across America as well. It is a city that was once a destination of the great migration out of the U.S. South; it is a port city which has an eroding industrial base and a stranded population that once depended on the now disappearing industries. It has also seen, in more recent years a decline in the Black population linked to escalating housing costs and other pressures toward “gentrification”.
Oakland is a city marked by polarization of wealth. In general, the wealthy residents of Oakland and the better off sections of the middle class live in what is known as the “hills” while the poorer residents live in what is known as the flatlands or flats. These are not absolute categories. There are many well off middle class people living in the flatlands which reach north of the city center and into the city of Berkeley. And others who are desperately poor also and mainly live in the flatlands. But the terms “hills” and “flatlands” are generally used by all who live there to distinguish between different sections and classes of people.
This is a preliminary report done mainly off Internet searches, though we did conduct one interview with a long time teacher activist who gave us insights into Oakland school issues. But while preliminary it has already revealed insights, the most striking of which is the way this oppressive system impacts the Black community and Latinos from so many different angles. One researcher described his feelings while uncovering the many suffocating layers of oppression that press down, especially on Black and Latino people, as “being dragged through an emotional hell.” While the sharpest and most “visible” aspects of this oppression are mass incarceration and police murder and abuse, every aspect of life is impacted, impinged on, distorted and twisted by this oppressive, white supremacist system. This report has already begun to elucidate that. We realize the importance of deepening this work and bringing into sharper focus the reality of what this system is, all for the purpose of aiding the struggle to transform the world.
This preliminary report on Black people in Oakland is divided into 6 sections:
- General Overview and Introduction
- Black Life Expectancy or Early Death Sentence
- Decline in Family Wealth and Rising Polarization of Wealth
- Demographic Shifts and the Decline of Oakland’s Black Population
- Harassment and Bullying: From the job to the streets: tightening the vice
- Youth: Education/Criminalization
Maybe it’s obvious, but let it be stated here—these categories are interrelated and there is inevitable overlap. Hopefully the overall report will paint a picture and give a deepened understanding of the oppressive and deteriorating conditions of Black people generally in Oakland.
The first section, General Overview and Intro, is at this point in outline form. It’s meant to give some context to changes that have taken place in the post war era, including, especially this more recent era of “gentrification” and the displacement of the Black population. The Eastmont Mall which is located in the heart of the ghetto in East Oakland is here used as a symbol of the deterioration of oppressed communities. It has involved from factory to shopping mall to today’s “mixed use, including a major police (occupying army) station.” Where Eastmont Mall sits today there was once a Chevrolet auto plant. Eastmont Mall is symbolic of the deterioration of the oppressed communities, the disappearance of above-poverty wage jobs.
The de-industrialization of Oakland has seen Black people pushed out of the exploitive production system, forced, at best, into low wage service jobs and subject to mass incarceration and police brutality/murder. More recently with “gentrification” they are being pushed out of the urban cores themselves, a phase with genocidal implications. This is not the result of some evil cabal, but the spontaneous workings of a system of capital accumulation.
On a deeper level it should be understood that we are looking at how “the driving force of anarchy” plays out in a society anchored in white supremacy and immense and ugly racial oppression. (Like water that flows through channels already impressed into the earth, capital flows into “pre-cut” depressions in the social order—ones that were carved early in the U.S. with the advent of slavery and have continued to shape the U.S. by the continual reassertion of white supremacy.) Or as described in BAsics, “There would be no United States as we know it today without slavery. That is a simple and basic truth.” (BAsics 1:1) Whether talking about the outcome of the financial collapse, foreclosures and the evaporation of Black household wealth or the parasitic bleeding of the Black community to sustain municipal budgets as in Ferguson, school “reform,” mass incarceration or police murder, white supremacy/Black oppression is revealed to be part of the essential foundation of this order. It is a caste-like system.
Here we can clearly see the Black masses fit the description of a people “in civil society but not of it” (Karl Marx). As Bob Avakian has commented, the bourgeoisie has never respected the rights of Black people as human beings and it never will.
(NOTE: Some of the trends noted in this report, like sub-prime auto loans, aspects of the wealth gap, youth incarceration, etc. are either national or state figures and we haven’t found or there aren’t available, corresponding local figures. In these and other cases—like people seeking free health exams – information does not include breakdowns by race, etc. Their relevance is presumed here. What would also be useful are anecdotes to illustrate the figures contained herein.)
****
General Overview and Introduction
Population of Oakland:
2000 – 399,484
2010 – 390,724
2014 – 405,000
Two years ago, Oakland was named the top North American city to visit, and it was ranked 16th on "America's Coolest Cities." (Probably not because of the sharp struggle of the Occupy movement.)
Oakland Demographics 2010 Census:
White non-Hispanic: 25.9%
Black: 28.0% (a loss of 25% since 2000)
Hispanic or Latino of any race: 25.4% (18.1% Mexican, 1.9% Salvadoran, 1.3% Guatemalan, 0.7% Puerto Rican)
Asian: 16.8%
Native Hawaiian and Pacific Islander: 0.6%
American Indian and Alaska Native: 0.8%
Other race: 13.7%
Two or more races: 5.6%
38% of the population over 25 have bachelors degree or higher. Oakland is in the top 20 cities in U.S. for median household income.
Oakland ranks 4th (of U.S. cities) in diversity, with a diversity score of 91.4.
White population was 95.3% in 1940, dropped to 32.5% in 1990.
Black Life Expectancy or an Early Death Sentence
The 15-year “discrepancy”:
- African Americans living in the Oakland flatlands have a life expectancy average of 70.5 years while African Americans in the Oakland hills 77.4 years
- A white person in the flats has life expectancy of 76.6
- A white person in the hills lives on average to be 82.5
On average, an African American in the Oakland flats will:
Die 15 years before a white person from the Oakland hills
Be 1.5 times more likely to be born prematurely
Be 7 times more likely to be born into poverty
Be 6 times more likely to drop out of school
Be 4 times more likely to be unemployed (Oakland Poverty Starter set 2009)
Sandra Witt, deputy director of public health: “People in the hills have higher incomes and education, better housing, they have health insurance, they live further from the freeway, they have more access to healthy food, to parks. (Elizabeth Fernandez, April 2008 – SF Gate – "Study Spotlights Bleak Effects of Poverty")
Factors: Infant mortality; access to good food and health care; air quality, exercise, mass incarceration and community/gang violence; psychological stress; police violence. (California’s African American infant mortality rate is roughly the same as Sri Lanka, Botswana, and other developing nations.)
Black children die more than twice as frequently as white children (2008). In the hills of Oakland there is one supermarket for every 13,000 residents; in the flat lands there is one supermarket for every 93,000. There are more liquor stores in the flatlands—“it’s easier to get drunk than to eat.” Environmental racism—asthma rate.
“You see it every day in the classroom,” said Manny Lopez, who teaches 4th Grade at Jefferson Elementary in Fruitvale. Lopez said more students are coming to school without needed eyeglasses or with painful toothaches that prevent them from focusing on schoolwork.” (Bay Citizen, 11-29-11)
“The underside of Oakland’s proud industrial legacy includes contaminated land and polluting industry sectors sited next to low-income communities.” (East Bay Alliance for a Sustainable Economy, 11-07)
Health Crisis: “Hundreds of uninsured, and under-insured lined up overnight outside the Oakland Coliseum in Oakland Wednesday for the chance to see a doctor or dentist, and get a free eye exam and maybe even a pair of glasses.” An oral surgeon expected to have his team examine 3000 people that day. (CBS News 3-22-12)
Decline in Black Family Wealth and Rising Polarization of Wealth
From 1984 to 2009 the total wealth gap (nationwide) between Blacks and whites increased from $85,000 to $236,500.
The largest single factor—home ownership:
From 2006 to 2009 African American wealth in Oakland dropped 53%.
Home ownership rate overall 2009-2013: 40%
Black-owned firms in Oakland 2007: 13.7% (well below the percentage of the Black population, 30%)
Residents with income below the poverty level in 2013: 19.4% (California 14.2%)
2008 to 2011: Child poverty rate exploded from 18% to 28% in Oakland—3 times the national average.
The foreclosure crisis:
- 10,508 completed foreclosures in Oakland 2007–2011.
- 93% of investor-acquired properties located in low-income flatland neighborhoods the same as those targeted by predatory lenders in years preceding the foreclosure crisis.
- 42% of foreclosed homes were acquired by investors. Investors acquired 45% (2,681) of the 5,923 sold by banks, GSEs, and government entities.*
- Oakland home foreclosure rate is 4.09%. More than 1 in 25 houses in Oakland were foreclosed in 2008 alone
- The richest 20% of Oakland residents have 52% of Oakland’s wealth
- The poorest 20% of Oakland residents have 3% of Oakland’s wealth
- (predatory loans) unemployment; cuts to social programs
(From: Who Owns Your Neighborhood The Role of Investors in Post-Foreclosure Oakland,Urban Strategies Council, 2012)
Rent crisis – displacement:
“During the past half-decade, large investors have bought up numerous foreclosed homes in West and East Oakland and have turned them into rental properties that many longtime residents cannot afford.” (East Bay Express, 4-2-14)
“As of the fourth quarter of 2014, the vacancy rate in SF stood at just 3.6%. Oakland was even worse with a vacancy rate of 2.9% though average rents were cheaper at $1,815.” Low vacancy rates lead to increases in rents. Oakland rents increased 10.5% from 2013 to 2014.
Sub-prime loans—on cars:
“Lending to these high-risk car-dependent borrowers is rising as investors feast on the high returns as lenders offer longer payment periods… The New York Times reported Monday that this ‘booming business in lending to the working poor’ is being urged by Wall Street’s appetite for higher returns on investment. Poor people pay higher interest on loans because they’re considered higher risk.” (Center for Responsible Lending; IB Times; NY Times)
Unemployment:
Nationally the unemployment rate for whites is 7%, while the Black unemployment rate is 13.8 percent. (Kai Ryssdal, 2-13)
Oakland’s unemployment rate rose from 8% to 16% from 2008 to 2011—in numbers from 15,000 to 30,000.
Homelessness/displacement:
- 49.2% of Alameda County’s (Oakland is in Alameda County) 6,215 homeless people live in Oakland.
- Families make up 43% and children comprise 28% of the county’s homeless population.
- Many of the homeless were previously incarcerated, hospitalized or in foster care.
- Most homeless families headed by young unemployed mom with 2 to 3 kids.
- Homeless children suffer more health problems than housed children.
- 38% of children in homeless shelters have asthma, middle ear infection prevalence is 50% higher than the national average
- Over 60% of homeless children are under vaccinated. (Redlener & Johnson, 1999)
- Nearly 20% of homeless children repeat a grade—16% are enrolled in special ed classes—100% and 33% higher than housed children; much of this is due to high mobility rate (Institute for Children and Poverty, 2001)
- There are approximately 560 homeless people living with HIV/AIDS in the county.
- About 34,000 (6%) of Alameda County’s 523,000 households are at severe risk of homelessness as low-income renters paying more than 50% of income on housing.
(FHA 1934 to 1968 explicit refusal to back loans to Black people – “redlining destroyed the possibility of investment wherever Black people lived”)
Demographic Shifts and Decline in Oakland's Black Population
- Oakland’s Black population peaked in 1980s and 90s when it reached 47% of the population.
- 2000 and 2010 it declined 35.7% to 28%, a decline of 33,000. Blacks have been relocating to suburbs and South of the U.S.
- Used to be, if you lived in S.F. and wanted someplace affordable, move to Oakland. Now if you want some place affordable move to Stockton (in the Central Valley of California) or beyond.
- Biggest decline in population—school-age children between 5 and 14, which fell by over 20% since 2000.
- The largest group of youth in Oakland today is children ages 0-5, with a population of over 26,000.
- Decline of school-aged children: 80,000 in 2000 to 60,000 in 2010, with 46,000 attending Oakland’s public schools.
The face of Oakland has changed rapidly. The Latino population has grown to almost 100,000 -- the largest ethnic group for children 0-20. Today, 42.5% of Oakland’s 390,724 residents speak a language other than English as their primary language at home. 25% of youth in poverty in 2007 to 32.7% in 2010. Youth are growing up in one of the most difficult labor markets in generations, and the level of youth ages 16-24 employed nationally is now at historic lows.
Harassment and Bullying: From the job to the streets—tightening the vise
“Suspending driver’s licenses has become a basic tool supposedly for enforcing the collection of unpaid fines. In practice, it serves as a way to systematically punish, and jail, poor people unable to pay court fees. It is another one of the ways that the criminal (in)justice system plays the role of gatekeeper for the New Jim Crow that the majority of Black people are forced to live under today.” (Revolution newspaper, May 25, 2015)
On the job; police; suspension of licenses, like in Ferguson, child support prosecutions, and other forms of legal harassment. Arrest rates for Blacks and Latinos: Between 2008 and 2013 Black children represented 29% of youth but 78% of those arrested.
Drivers’ licenses (From Lawyers’ Committee for Civil Rights):
- Like Ferguson, people of color in California are disproportionately impacted by license suspensions. Police disproportionately make traffic stops of people of color, particularly African Americans.
- In two Sacramento neighborhoods, Blacks comprised 7.2% and 8.6% of the pop., but 22.4% and 27.7% of drivers stopped.
- In San Diego in 2014, Black drivers made up 11.2% of traffic stops and 23.4% of searches, but only 5.5% of the San Diego population.
- The past 4 years the Lawyers’ Committee for Civil Right’s legal clinic in S.F. for people with past arrests and convictions: A total of 507 clients—132 clients sought help with issues related to their driver’s licenses. Blacks were 55.6% of clients, and 70.4% of clients with driver’s license issues.
- Blacks are 6% of the San Francisco population as a whole. In addition, the overlap between license suspensions and criminal justice involvement also leads to racial disparities in suspensions.
- The statistics above indicate that traffic stops and license suspensions fall disproportionately on people of color. Recent events in San Francisco suggest that the problem is not just one of disparate racial impact, but direct and institutionalized racism. In March 2015, the San Francisco Police Department initiated a department probe of racist text messages and emails by more than ten of its officers.
- Data indicate that 17%, or approximately 1 in 6 licenses is suspended in California.
The uncollected court-ordered debt now exceeds $10 billion.
Youth Education/Criminalization
Schools as pipelines to prison: dropout rates; privatization/charterization.
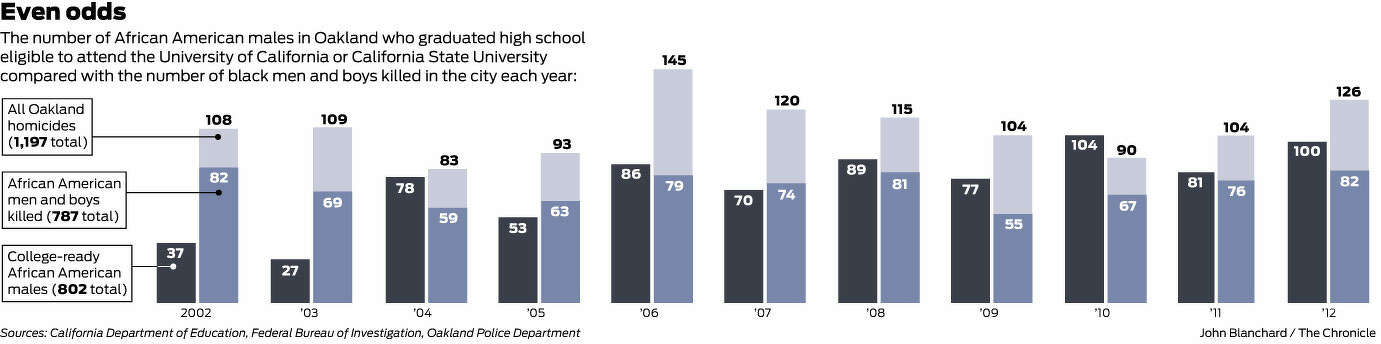
- In recent years, Black boys have been about as likely to be shot to death as they are to graduate from high school college-ready.
- Black youth expulsion rates as part of the alienation of Black youth from the schools. Include kindergarten first grade absenteeism. African American boys were 4 times as likely as their white peers to be chronically absent from school. According to one administrator missing a month of school or more can put you off track for learning to read in the third grade.
- In 2010-11 Black males were 17% of OUSD population and had 42% of suspensions.
- Suspensions mainly come from administrators.
- If the schools look and smell like shit (which they do) the students will also treat it like shit. There was a principal who locked the Boys Bathrooms the whole day. (J, a veteran teacher)
- Kids are coming to school who they haven’t eaten the day before; they come from group homes where there’s no place to study; they’re pushed out to the street to deal drugs from the third grade with the reason most often given—“defiance of authority.”
- Urban Strategies Council Study: 55 % of African American boys in 2010-2011 school year were falling off course for graduation.
- Graduation rates for college. Nationally among lower income people it’s 14%. In Oakland probably lower. “What they’ve done is rigged up these statistics where they graduate more kids from high school and then flunk them out of college. And they don’t have jobs. That’s going on in Oakland.” (from veteran teacher J).
- Castlemont High used to be overwhelmingly Black, now it is just about 50%; Fremont High School is a large majority Latino; and McClymonds High School is 250 students.
- Turnover rate among teachers in Oakland is “sky high”.
- Most teachers are angry about being paid 20% less than state and county averages; and unacceptably large caseloads for counselors; no limits on size of special ed classes.
- Teachers in the schools in the hills have a higher morale.
Charter Schools:
- Oakland is among the most “charterized” school districts in the country.
- Charters can turn away “under achievers”, special ed kids, etc.
- In the 2003 – 4 school year there were something in the order of 53,000 students, only 2,000 of which were in charter schools. Now there are 37,000 students in public schools and 11,000 in charters. Some students moved out of the district, some to private schools.
- Charters weaken the unions.
- Promote narrow mentality of looking at “my school” vs other schools -- pits school against school and it’s penetrated into the public schools. (From teacher J)
- Charter schools are backdoor vouchers. The more money and students charters get the more it weakens the public schools.
- Charters are selective of who they admit and they also push students out. There are stories of students subjected to humiliating behavior. At the American Indian charter schools Black students were mistreated and harassed in an effort to force them out. And that school won a red ribbon from the U.S. Department of Education as one of the outstanding charters in the country.
Diminishing Public Schools:
- In 2003-4 school year, Castlemont High had 1500 students; Fremont High had about 2250; McClymonds High had about 1000 – about 5 thousand for those three high schools.
- The 3 combined today have fewer than 1500. Those are the 3 (public) high schools that serve the Black and Latino community. Fremont serves the Fruitvale and part of East Oakland; Castlemont serves deep East Oakland; and McClymonds is West Oakland.
- They were broken up into small schools. In so doing they closed the libraries and laid off the librarians; eliminated French language teaching; closed all the vocational programs.
- Schools as one of the few anchors of stability in oppressed communities. Shutting them down or breaking them up creates instability.
Links between Oakland Unified School District and the Oakland Police Department:
Youth incarceration in Alameda County:
Nationality (2011) (2013)
White 5.4 per 1000 3.6 per 1000
Latino 9.8 per 1000 7.1 per 1000
Black 42 per 1000 28.9 per 1000
(From Unbalanced Juvenile Justice – Burns Institute, 2013)
Youth in poverty in Alameda: (kidsdata.org)
* “The spike in non-local ownership and non-owner occupied housing presents concerns related to the extraction of wealth from low-income neighborhoods, in addition to ongoing property maintenance and management issues. Given the nearly exclusive focus of investor activity in Oakland’s flatland neighborhoods, a range of apprehensions emerge regarding shifting tenure, neighborhood succession, and the displacement of residents. Embedded in all of these issues is the underlying question about the strategies and intentions of both banks and investors in Oakland. A bank’s decision to sell a foreclosed property to a limited liability corporation as opposed to a working family produces a very different outcome for the community. This decision made repeatedly over thousands of transactions amounts to a sea change in the composition and tenure of neighborhoods. In a piecemeal process, banks and the GSEs are essentially selling the control and ownership of neighborhoods to non-resident investors and corporations.” (Who Owns Your Neighborhood: The Role of Investors in Post-Foreclosure Oakland, Urban Strategies Council, 2012, page 5) [back]
Sources:
Rising rents and concentrations of wealth
East Bay Express, 04-02-14 "Neill Sullivan's Oakland"
Forbes Lists SF one of the worst cities for renters
Foreclosures:
http://www.neighborhoodindicators.org/sites/default/files/publications/whoownsyourneighborhood_report.pdf
Sub prime loaning on cars
Center for Responsible Lending-Identifies-Risks-Lurking-in-the-Subprime-Auto-Market.html
http://www.ibtimes.com/heres-why-high-risk-subprime-auto-loans-are-growing-auto-loan-defaults-arent-1796804
http://dealbook.nytimes.com/2015/01/26/investment-riches-built-on-auto-loans-to-poor/?_r=1
Health care
hundreds-wait-overnight-at-oakland-coliseum-for-free-medical-services/
Youth incarceration
Burns Institute for Juvenil Justice and Equality Youth incarceration figures 2011
Education
Volunteers Needed... for revcom.us and Revolution
If you like this article, subscribe, donate to and sustain Revolution newspaper.


.")

